

What is CO2?
Carbon dioxide (CO2) is the primary greenhouse gas emitted through human activities, accounting for about 82% of all human-related U.S. greenhouse gas emissions in 2016. Human activities, including driving gas and diesel-powered vehicles, are adding more CO2 to the atmosphere than our planet is designed to process through its natural cycles. While CO2 emissions come from a variety of natural sources, human-related emissions are responsible for the significant increase that has occurred in the atmosphere over the last 200 years.1Why do CO2 levels matter?
When energy from the sun reaches the Earth, the planet absorbs some of this energy and radiates the rest back to space as heat. The Earth’s surface temperature depends on this balance between incoming and outgoing energy. Increases in greenhouse gas concentrations in the atmosphere cause a portion of the heat that normally would radiate away for the planet to be absorbed, re-emitting heat to the lower atmosphere and warming the Earth’s surface. This adds up over time in the form of long-term global warming - it is not observed as a short-term local weather event.2Global warming refers to the long-term warming of the planet since the early 20th century, and most notably since the late 1970s, due to the increase in fossil fuel emissions since the Industrial Revolution. Worldwide since 1880, the average surface temperature has gone up by about 1 °C (about 2 °F), relative to the mid-20th-century baseline (of 1951-1980).3
How can we possibly be producing that much CO2?
It's chemistry and it adds up quickly. A gallon of gasoline weighs about 6.3 pounds, but it can produce about 20 pounds of CO2 when burned. Most of the weight of the CO2 doesn't come from the gasoline itself, but the oxygen it joins with in the air. When gasoline burns, the carbon and hydrogen in the fuel separate, then the hydrogen combines with oxygen to form water (H2O), and carbon combines with oxygen to form carbon dioxide (CO2).A CO2 molecule is made with one carbon atom and two oxygen atoms. Carbon atom has an atomic weight of 12, and each oxygen atom has a weight of 16, giving each single molecule of CO2 an atomic weight of 44. Therefore, to calculate the amount of CO2 produced from a gallon of gasoline, the weight of the carbon in the gasoline is multiplied by 44/12 or 3.7. Since gasoline is about 87% carbon and 13% hydrogen by weight, the carbon in a gallon of gasoline weighs 5.5 pounds (6.3 lbs. x .87). We can then multiply the weight of the carbon (5.5 pounds) by 3.7, which equals about 20 pounds of CO2.4
What do all of these pounds of CO2 mean to you?
There is a lot science required to quantify the impact of the tons of CO2 that come out of your tailpipe and the rest of the tailpipes on our planet. The important thing to note is that transportation generates approximately 34% of the greenhouse gas emissions in the United States.5 We have the opportunity to dramatically reduce this number by switching from fossil fuel-burning vehicles to vehicles that are powered by electricity generated through methods that produce less greenhouse gases.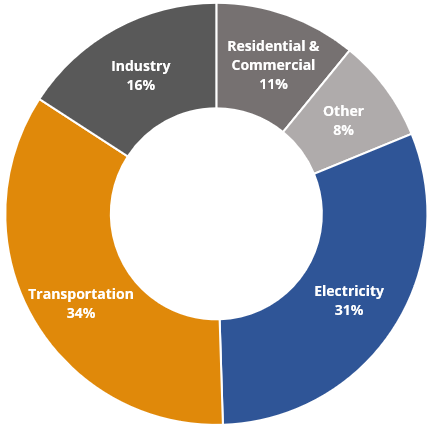
1National Research Council. The National Academies Press, Washington, DC, USA.
https://www.epa.gov/ghgemissions/overview-greenhouse-gases
2United States Environmental Protection Agency - Climate Change Indicators: Climate Forcing.
https://www.epa.gov/climate-indicators/climate-change-indicators-climate-forcing
3NASA: Global Climate Change. Retrieved January 30, 2019, from
https://climate.nasa.gov/resources/global-warming/
4 Physical and chemical properties of gasoline: Department of Energy (DOE), Alternative Fuels Data Center (AFDC), Properties of Fuels.
https://www.fueleconomy.gov/feg/contentIncludes/co2_inc.htm
5U.S. Environmental Protection Agency (2018). Inventory of U.S. Greenhouse Gas Emissions and Sinks: 1990-2016.
https://www.epa.gov/ghgemissions/overview-greenhouse-gases